


Smart E-Waste Management: From Smart Bins to an Intelligent Urban Waste System
TL;DR The Smart E-Waste Management System demonstrates how IoT, edge AI, predictive analytics, route optimization, and digital traceability can transform waste management from a reactive collection process into…
August 11, 2026 · 11 min read
TL;DR
The Smart E-Waste Management System demonstrates how IoT, edge AI, predictive analytics, route optimization, and digital traceability can transform waste management from a reactive collection process into a data-driven operating system.
The system classifies waste at the edge with reported 95%+ accuracy, continuously monitors smart-bin telemetry, predicts future fill levels, optimizes collection routes, and tracks material from disposal through recovery.
In the documented pilot, the system reported 42% fewer unnecessary collection trips, 30–40% fuel savings, an 88% recycling rate, and approximately 35% operational cost reduction.
The larger lesson goes beyond waste management: AI creates enterprise value when it is connected to real operational decisions, measurable outcomes, and a production-ready engineering architecture—not when it exists as an isolated model.
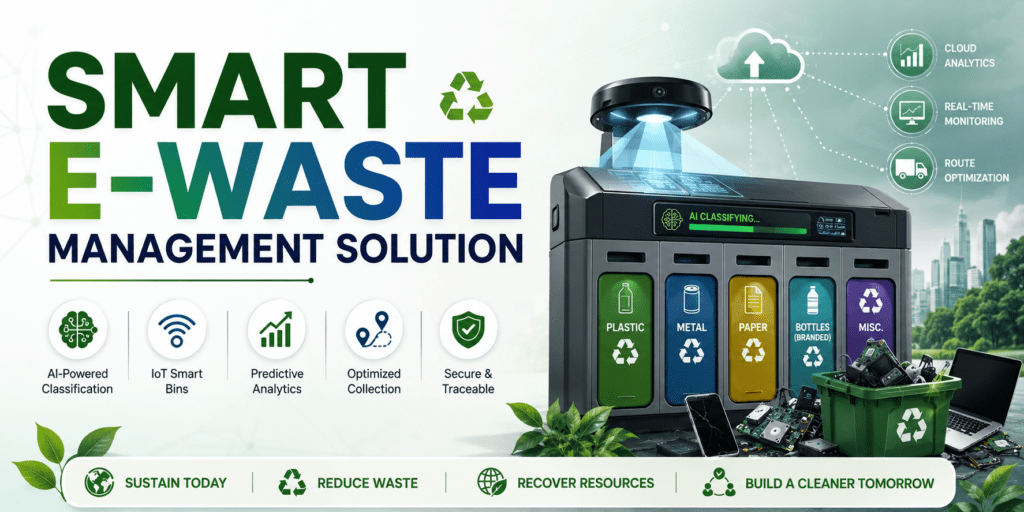
Waste management is usually discussed in terms of collection, transportation, recycling, and disposal.
But there is another problem underneath all of this: most waste operations have very little intelligence at the point where waste enters the system.
A collection vehicle may visit a bin because the schedule says it should, not because the bin actually needs to be collected. Recyclable material may be mixed with other waste before anyone has an opportunity to separate it. As a result, once material leaves the collection point, tracking what happens to it becomes difficult.
The result is a system that is largely reactive.
However, the Smart E-Waste Management System described in Case Study 010 takes a different approach. Additionally, it combines smart bins, edge AI, IoT telemetry, predictive analytics, route optimization, QR tracking, and dashboards.
However, the interesting part is not that a camera can classify waste.
However, the interesting part is what happens after the classification.
Additionally, the system uses information to improve collection decisions, track movement, measure recovery, and connect waste operations with outcomes.
Read the complete Case Study 010 on GitHub
The Problem: Waste Collection Is Still Too Reactive
Traditional collection systems generally operate with limited real-time information.
Because Of:
- A vehicle follows a predefined route.
- Collection happens at scheduled intervals.
- Operators may not know the actual fill level of every bin until someone physically checks it.
This creates an obvious inefficiency – A vehicle can arrive at a bin that is only partially full, while another bin may already be overflowing.
Both situations cost money –
The first wastes fuel, vehicle capacity, and labor.
The second creates poor service quality and potentially increases environmental and public-health risks.
There is another problem: segregation.
When plastic, metal, paper, bottles, and miscellaneous waste are mixed together, recovering valuable materials becomes harder. Thus, manual sorting is slow, inconsistent, and expensive.
Then comes the visibility problem.
Once waste leaves a bin, the organization may know that it was collected, but not necessarily what happened afterward. Was it delivered to the expected facility? How much material was recovered? What percentage was actually recycled?
For municipalities, waste operators, and producers dealing with environmental reporting, this missing chain of information matters.
The case study therefore identifies four connected challenges:
- inefficient and reactive collection;
- poor source segregation;
- limited material traceability;
- fragmented operational decision-making.
These are not four separate problems.
They are symptoms of the same underlying issue:
The waste-management process does not have a continuous intelligence loop connecting what happens in the physical world with what the organization does next.
The Idea: Make the Bin Part of the Intelligence System
The solution starts by changing the role of the bin. Instead of treating it as a passive container, the architecture turns it into an intelligent edge device. When a person disposes of waste, a camera and sensors capture information about the material.
An edge-based convolutional neural network classifies the item into five categories:
- Plastic
- Metal
- Paper
- Bottles
- Miscellaneous
The case study reports classification accuracy above 95%.The system then directs the waste into the appropriate compartment and records information such as weight, timestamp, and classification.
This is where the architecture makes an important decision: the first AI decision happens at the edge. The image does not necessarily need to travel to the cloud before the system can act.
Using transfer-learned models such as ResNet or EfficientNet with TensorFlow Lite allows inference to happen close to the physical process.
That matters for three reasons:
- Latency — the decision can happen quickly.
- Connectivity resilience — the bin can continue operating during network interruptions.
- Bandwidth — not every image needs to be continuously transmitted to a central service.
This is a useful pattern for many physical-world AI applications. The cloud should not necessarily make every decision.
Sometimes the best architecture is: Local intelligence for immediate decisions + cloud intelligence for coordination and optimization.
From a Smart Bin to an IoT Asset
Classification is only the first layer.
Each smart bin also collects operational telemetry.
The documented system captures information including:
- weight by compartment;
- temperature;
- GPS location;
- fill percentage;
- operational status;
- last collection time.
Telemetry is transmitted using MQTT, with AWS IoT Core providing the cloud connectivity layer.
The case study describes approximately 15-minute telemetry intervals, offline buffering, and immediate alerts for critical events.
This changes the operational model.
Instead of asking a supervisor to check bins manually, the platform can provide a live view of the physical infrastructure.
The dashboard can answer questions such as:
- Which bins are filling up?
- Where are they located?
- How much material has been collected?
- Which bins require attention?
- Are there critical alerts?
The physical infrastructure has effectively become a source of continuously available operational data.
Monitoring Is Useful. Prediction Is Better.
Real-time monitoring solves only part of the problem.
Knowing that a bin is 70% full is useful.
Knowing that it will probably reach capacity tomorrow afternoon is much more useful.
The platform therefore adds predictive analytics.
Time-series approaches such as LSTM and Prophet are used to forecast fill levels and expected full times. Historical patterns, location, day-of-week effects, and external variables can contribute to the prediction.
This creates a fundamental change in the operating model.
Instead of: “Which bins are full?”
the operator can ask: “Which bins will need collection next?”
That distinction is important because transportation is one of the major cost components in waste operations.
Prediction becomes valuable only when it changes what the organization does.
That leads to the next layer.
From Prediction to Route Optimization
The system connects predicted fill levels with route planning.
The route-optimization process considers factors such as:
- current fill level
- predicted fill level
- vehicle capacity
- traffic
- crew availability
- collection priority
The goal is not simply to find the shortest route.
The goal is to find a route that makes operational sense given what is likely to happen next.
That is a much more interesting optimization problem.
A truck might pass a half-empty bin today because the prediction indicates it will not require collection until tomorrow.
Another bin might receive priority because it is expected to reach capacity before the next scheduled route.
The case study reports a 42% reduction in unnecessary collection trips, approximately 50% route-efficiency improvement, and 30–40% fuel savings during the documented pilot/business-case evaluation.
These numbers should not be interpreted as universal benchmarks. They are reported results from the case study and will naturally vary by city, geography, fleet utilization, waste composition, traffic conditions, and operating practices.
But the direction of the improvement is important.
The system is using AI not simply to recognize waste, but to change the economics of collection.
Closing the Traceability Gap
There is another part of the system that is easy to overlook.
What happens after collection?
The platform introduces QR-based tracking to follow material through the waste lifecycle:
Disposal → Collection → Transportation → Facility Receipt → Processing → Recovery
This creates a digital chain of custody.
For a municipality, this can improve operational accountability.
For waste operators, it provides better visibility into material flows.
For producers and organizations dealing with Extended Producer Responsibility (EPR), traceability can help support reporting and verification.
The case study also identifies optional blockchain support for immutable records.
But blockchain is not the central innovation here.
The important idea is simpler:
If the organization cannot trace what happened to the material, it cannot reliably measure the outcome of the waste-management process.
Traceability turns waste from an invisible operational flow into measurable data.
The Architecture Behind the System
The platform combines edge hardware, cloud infrastructure, backend services, machine learning, and user-facing applications.
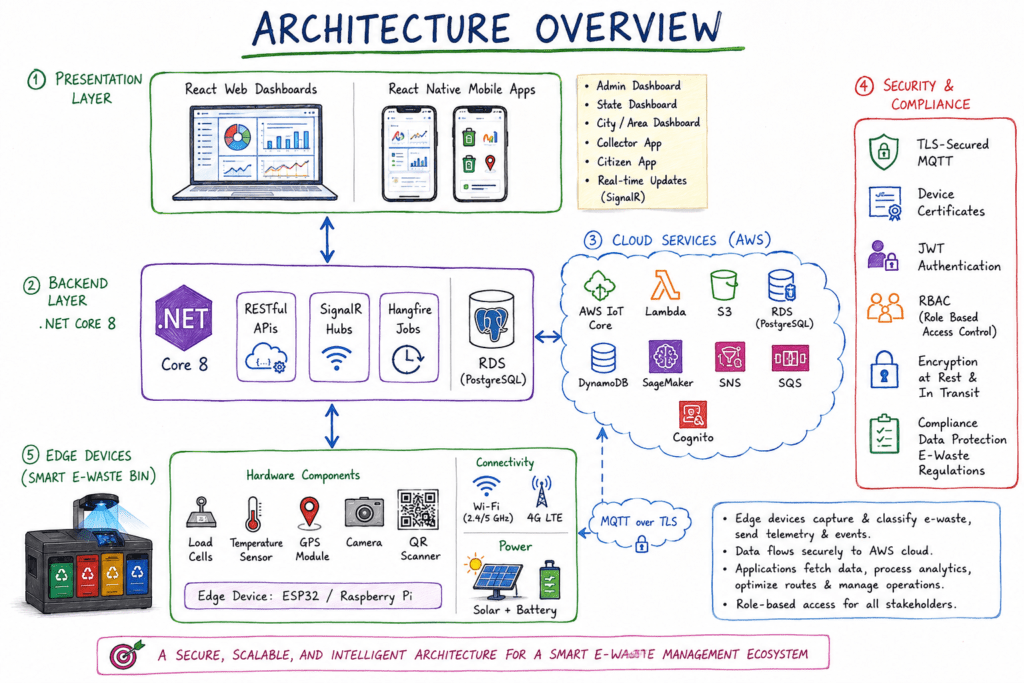
At the edge, the architecture uses devices such as ESP32 or Raspberry Pi, together with cameras, load cells, temperature sensors, GPS, QR scanners, and Wi-Fi/4G connectivity.
The cloud and application layer includes:
- AWS IoT Core
- Lambda
- S3
- RDS PostgreSQL
- DynamoDB
- SageMaker
- SNS/SQS
- Cognito
- .NET Core 8
- React
- React Native
- SignalR
- Hangfire
The architecture also includes TLS-secured MQTT, device certificates, JWT authentication, role-based access control, and encryption.
At a high level, the architecture looks like this:
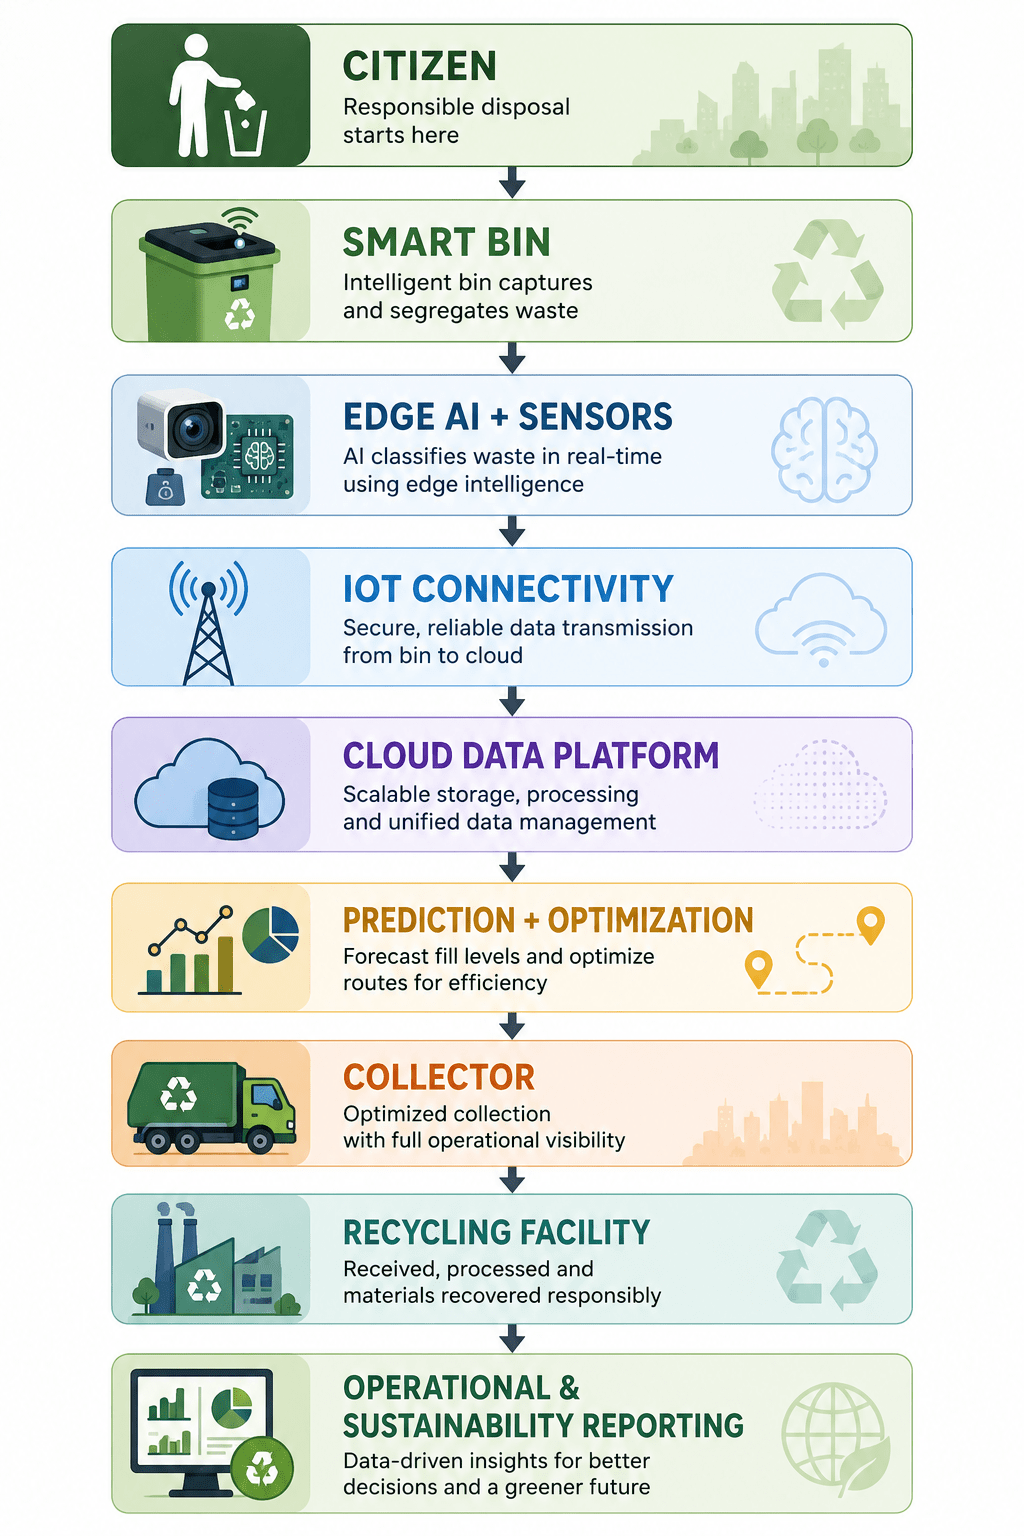
This is what makes the system different from a conventional computer-vision project.
The model is only one component. The real system is the complete chain.
From Prototype to Production
This is also where the case study connects to a broader question in enterprise AI engineering:
When does an AI prototype actually become a production system?
A model working in a controlled environment is not enough. A production system has to deal with hardware failures, poor connectivity, changing data, operational users, security, monitoring, scaling, and economics.
The implementation therefore followed a phased roadmap.
Phase 1 — Foundation
Phase 2 — Core Features
Phase 3 — Advanced Capabilities
Phase 4 — Pilot
Phase 5 — Scale
This phased approach is important. A physical AI system cannot be fully validated from a laptop. The real environment introduces problems that are difficult to simulate: weather, power, connectivity, sensor reliability, actual waste composition, human behavior, and maintenance.
The pilot is therefore not just a demonstration – It is part of the engineering process.
What the Case Study Gets Right
The most important lessons are not about AWS, TensorFlow, .NET, or any individual technology.
They are about system design.
1. Put Intelligence Where It Is Needed
Edge AI makes sense when a decision needs to happen close to the physical process. Not everything needs to go to the cloud.
2. Don’t Stop at Prediction
A prediction has little value if nobody changes their behavior because of it. The strongest part of the design is the connection between forecasting and route optimization.
Prediction becomes valuable when it changes an operational decision.
3. Design Hardware and Software Together
Physical systems behave differently from software applications. Power, connectivity, weather, sensor degradation, installation quality, and maintenance all affect the final product.
That is why the pilot matters.
4. Measure the Business Outcome
A 95% accurate classification model is interesting. A 95% accurate model that also reduces unnecessary trips, fuel consumption, and operating costs is a business asset.
The difference is significant.
5. Build Traceability Into the System
If material cannot be traced, recovery cannot be reliably measured. Traceability also creates opportunities for better compliance, reporting, and accountability.
6. Treat Data Quality as Infrastructure
Predictive models are only as good as the data feeding them. Sensor consistency, timestamps, historical records, classification quality, and operational feedback become increasingly important as the system scales.
The Bigger Lesson: AI Is Becoming Infrastructure
The most interesting thing about this case study is not the smart bin.
It is the architecture behind it.
The system follows a simple but powerful loop: Sense → Understand → Predict → Decide → Act → Measure → Improve
Sensors provide the raw signals.
Edge AI interprets the physical world.
IoT makes those signals available.
Predictive models estimate what happens next.
Optimization determines what should happen.
Operational software enables people to act.
Measurement shows whether the decision actually created value.
And the resulting data feeds the next cycle.
That pattern extends far beyond waste management.
It can be applied to manufacturing, logistics, energy, agriculture, healthcare operations, smart buildings, and other environments where software interacts with the physical world.
This is also why the transition from prototype to production matters so much.
A prototype demonstrates possibility.
A production system has to demonstrate repeatability, reliability, governance, scalability, and economic value.
Conclusion
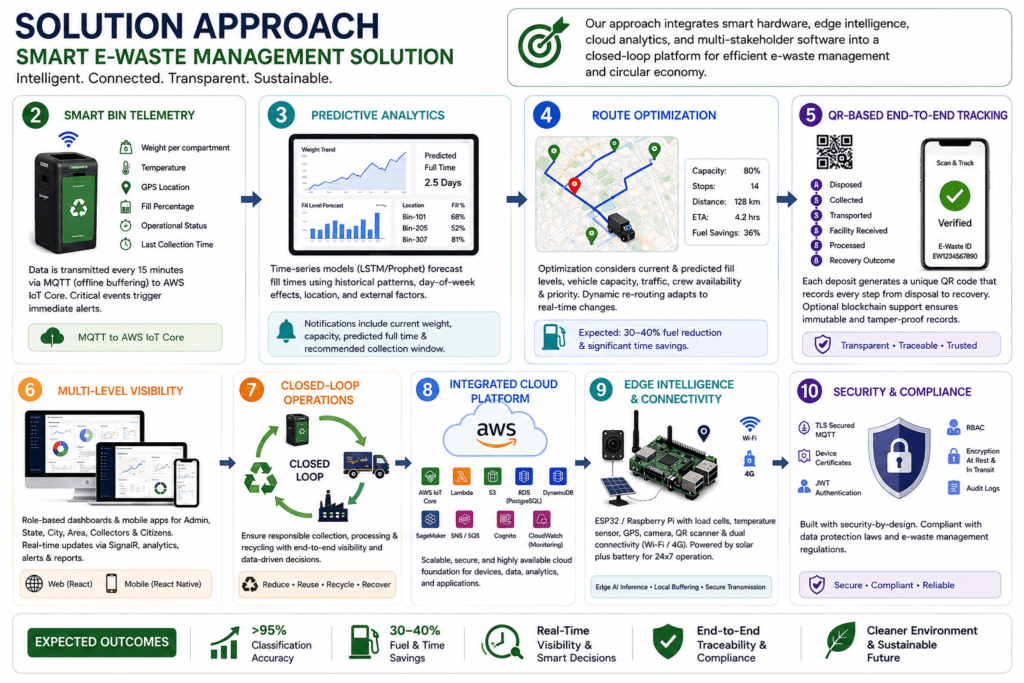
The Smart E-Waste Management System is a useful example of what happens when AI is treated as part of a larger engineering system rather than as an isolated model.
The camera classification is only the beginning. The real value emerges when classification connects to IoT telemetry, predictive analytics, route optimization, material traceability, operational workflows, and measurable financial outcomes.
The documented pilot reports 95%+ classification accuracy, 42% fewer unnecessary collection trips, 30–40% fuel savings, an 88% recycling rate, and approximately 35% operational cost reduction.
The broader lesson is more important than any individual metric.
Production AI is not about putting a model into production. It is about putting intelligence into an operating system that can reliably create value.
In this case, that operating system happens to manage waste.
But the architecture—and the engineering thinking behind it—can be applied much more broadly.
Reference
Go deeper
Have the same problem, different constraints?
These notes are general by necessity. Tell us the specifics and we will tell you how we would approach it.
We reply within one business day